
AI Builder is a fantastic capability and is getting more and more traction with the fast development of Large Language Models and the recent addition of the AI Builder OpenAI model. However, the way to manage AI Builder consumption and licensing is not as straight forward as one might like. Here is what I learned about AI Builder, how to monitor consumption and how to create a consumption dashboard to remain on top of it all.
On this page
What is AI Builder?
With AI Builder, Makers can consume AI models without any code. They can build and train custom models (document processing, object detection, and prediction to name a few), prior to consuming them from Power Apps and Power Automate. Makers can also use a vast quantity of pre-built models. Such models do not require any configuration, such as the business card reader, the invoice processing and the sentiment analysis models.
Which license is required to use AI Builder?
There are two types of license to leverage AI Builder:
-
Power Apps and/or Power Automate premium license
The AI models are stored in Dataverse. As a result, connecting to a model from Power Apps or Power Automate requires a premium license, as for premium connectors. Though several options are available, the most common ones are the Power Apps Premium (ex “Power Apps per User”) and the Power Automate Premium plans (replacing the old “Power Automate with Attended RPA” and “Power Automate per User” plans). -
AI Builder capacity
Training and consuming an AI Models consume AI credits which Admins have to purchase and provision for the respective tenant. Such credits are not assigned to users but are rather allocated to environments. There are a few things worth noting about these AI credits:-
The credits that are not allocated to a specific environment can be used in any environments,
-
The credits are purchased by bundles. One AI Builder Capacity pack includes 1 million credits per month,
-
Purchasing premium user licenses (such as the Power Apps per User plan) automatically provisions some credits in the tenant (capped at 1,000,000),
-
Tenant admins can check he amount of AI credits available in the tenant and allocated to each environment from the Power Platform Admin Center capacity page.
-
How can we monitor the actual AI Builder consumption?
Indeed, though it is good to track the credits available in the tenant, admins will likely want to monitor and manage AI Builder consumption. This is key to identify successful solutions that are leveraging AI as well as to manage and anticipate costs.
Environment and tenant admins have now the possibility to export AI Builder consumption reports from the Power Platform Admin Center in csv format (https://admin.powerplatform.microsoft.com/resources/downloadreports). The principle is very similar as the one to extract Power Platform request reports that we discussed in another post.
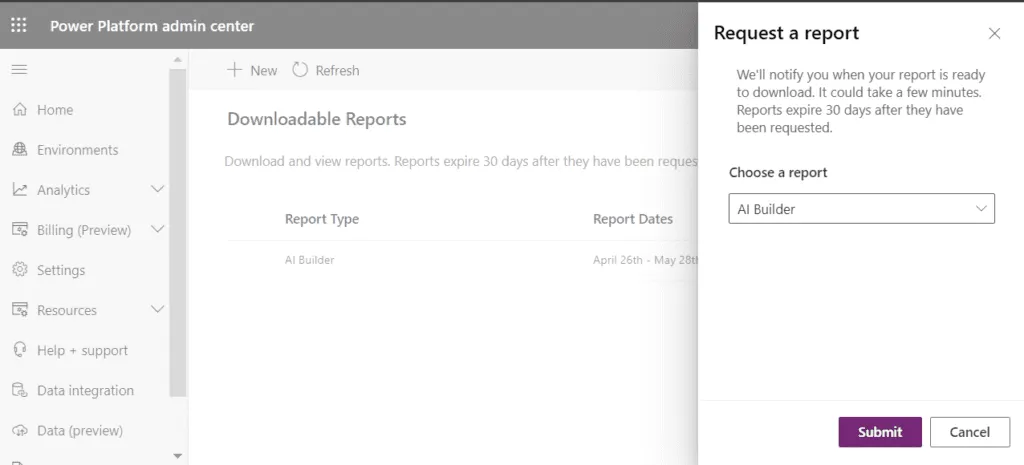
Here are some key points about the extracted AI Builder reports:
-
Admins can only extract the reports manually from the admin center,
-
They include 1 month worth of data,
-
The reports only include the data related to the environments in which the extracting user is an admin of. If they are the tenant admin, they will see everything,
-
The reports include the quantity of credits consumed each day for each user in each environment,
-
The extracted reports identify the users and environments with their respective Ids.
However, these row data extracts with user and environment ids might not be sufficient for admins to get actionable insight. Hence this post!
⚠ Update: Since writing this post, the PPAC Reports Extractor automates the daily download of AI Builder reports (alongside API Calls, Power Pages, and Copilot Studio) to SharePoint, with a single combined Power BI template. If you’re setting this up from scratch, that’s the recommended path. No manual monthly extraction needed. The steps below remain valid for standalone or custom setups.
How can we enhance the exported data to better monitor AI Builder consumption?
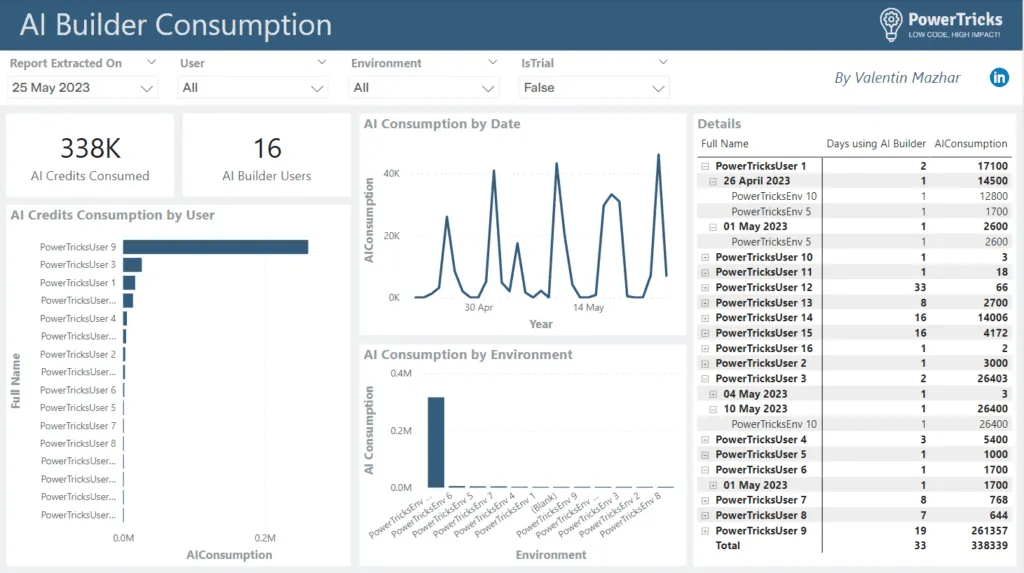
You can leverage Power BI to visualize the data in a much better way. In fact, the key is to extend the environment and user details to get more information. The trick is to use the default and CoE kit environments:
An admin can create this dashboard by following the instructions below:
-
Choose a SharePoint folder to store the reports that you will extract each month.
-
Create a Power BI report and connect it to the SharePoint folder. Combine all the files in the same table. In the Power Query, create a column to contain the date of the report extraction.
-
Connect to the Dataverse CoE Kit environment table. This is necessary to access the environment display name thanks to the environment ids included in the consumption report.
-
Connect to the Dataverse systemuser table of the default Power Platform environment. This will allow to show the user details thanks to their ids included in the consumption report. Note that you can also use CoE Kit environment instead if it has not a security group assigned.
-
Add relationships between the main consumption table and the two other Dataverse tables.
-
Have fun with the visualization!
As a bonus… You can configure Row level security (RLS) in Power BI to only share the data relevant for each user or team. Certainly this can be worth for wide organizations, where each user who opens the report would only see their own AI Builder consumption. For international companies, RLS could also be used to give to share the report with regional admins so that they can follow the consumption in their respective region.
The AI Builder template described above is also included in the combined PPAC Reports Extractor Power BI report.
Is there any Power BI report templates for this?
There wasn’t… But now there is! I created a Power BI template with a few parameters for you to leverage this report easily. Check out my GitHub repository to download the template “AI Builder Consumption Template.pbit”. I hope this will help you better manage AI Builder consumption in your organization.
Newsletter
Stay in the loop
Get notified when I publish new articles on Power Platform Governance.

About Valentin Mazhar
Microsoft MVP and certified Solution Architect specializing in enterprise Power Platform governance, AI enablement, and operating models. With 5+ years delivering governance programs in regulated environments, Valentin helps organizations scale low-code and AI securely, building the foundations that let makers and agents thrive without compromising control.


