
Microsoft introduced the so called “Power Platform request limits”, previously referred to as “API calls”. This concept can provoke headaches to both admins and makers trying to understand the potential impact for them. In this post we will see how admins can create a dashboard to monitor power platform requests for a better governance over consumption and anticipate potential impact.
On this page
What are these Power Platform requests?
In a nutshell, any action performed by a user in a Power Automate flow, a Power Apps app or Dataverse counts as a Power Platform request. You can find more information about what exactly constitutes a request in Microsoft official documentation.
What are the limits in place and what do they imply?
There are different types of limits for different situations. In this post we will focus on the limits imposed to Makers and end users. Each user has a specific limit of requests that they can execute per 24 hours. These limits depend on the licenses that each user has: the more the licenses, the higher the limit.
Microsoft explains that users can expect some form of throttling if they reach their requests limit. In other words, the action in the flow or app will fail. Microsoft is not currently strictly enforcing these limits, (dramatic music starts…) but they will (dramatic music ends).
Admins can purchase and assign Power Platform requests capacity addons to users to augment their limits. Such addons cannot be split between users and provide additional requests per month per addon.
How can we monitor our Power Platform requests to improve governance?
This is a fair question! In fact, there are several questions that admin and makers might want to answer:
-
How many requests can they execute?
-
How many requests are they actually executing?
-
What would be the impact of a strict enforcement?
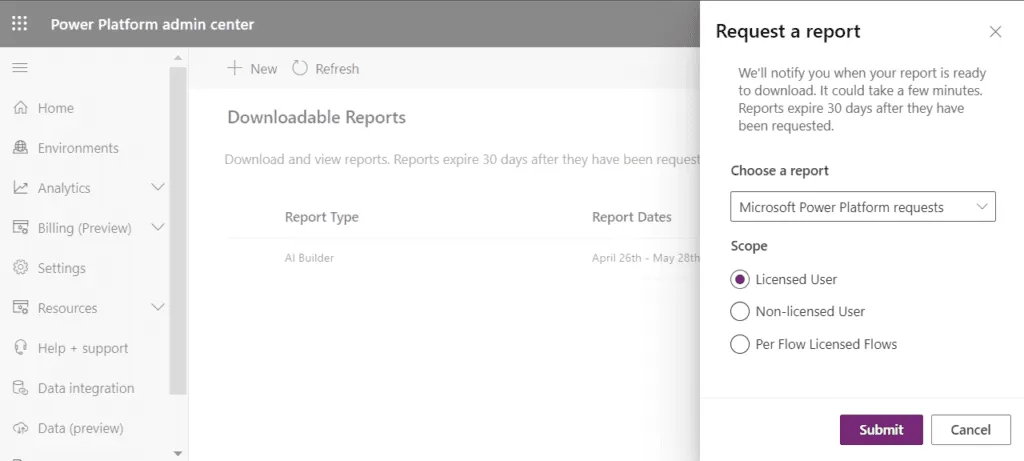
Luckily for us, there is a way to get to this information. Indeed, Microsoft recently added a functionality to extract Power Platform requests reports in a csv format. And the principle is very similar as the one to extract AI Builder consumption reports that I described in another post. Admins can extract reports from the Power Platform Admin Center (https://admin.powerplatform.microsoft.com/resources/downloadreports).
-
Admins have to extract these reports manually and they contain a month worth of data, identifying users with their user ids,
-
Each report consists in a log of the quantity of requests executed by each user, each day, on each environment. These requests are split by product,
-
The user who extracts the reports will see the data related to all the environments they are an admin of. If they are the tenant admin, they will see everything.
Due to the complexity of the request and entitlement concepts, the csv extracts are not enough to get actionable insight from the data.
⚠ Update: Since writing this post, the PPAC Reports Extractor automates the daily download of these reports (alongside AI Builder, Power Pages, and Copilot Studio) to SharePoint, with a combined Power BI template. If you’re setting this up from scratch, that’s the recommended path. No manual monthly extraction needed. The steps below remain valid for standalone or custom setups.
How can we better analyze the impact of a strict limit enforcement?
The challenges
The challenges to work with the extracted csv reports include:
-
Simply summing the requests for each user and comparing with the sum of entitlements for each of them will not provide the desired result. Indeed, a user could be far above their entitlements for a few days, but not consume anything the rest of the month, in which case the total requests will still be inferior than the total entitlement. Therefore the calculation needs to happen for each day.
-
If we consider the licenses allocation fixed, each day that a user is above their entitlement, they would need a certain amount of addons in order to avoid throttling. The amount of addons that they would need can be calculated for each day. At the end of the month, we need to know the maximum amount of addons needed by a user during the month to know how much addons would have been required for that user, and not the sum.
-
The entitlement for a user is shown for each row in the csv and there is one row per user per environment per day. However since the entitlements are tracked at user level for a given day, we cannot simply sum the entitlements across environments.
-
The csv does not include the user details and only includes their ids.
The solution
We can use Power BI to overcome these challenges and efficiently monitor platform requests for a better platform governance.
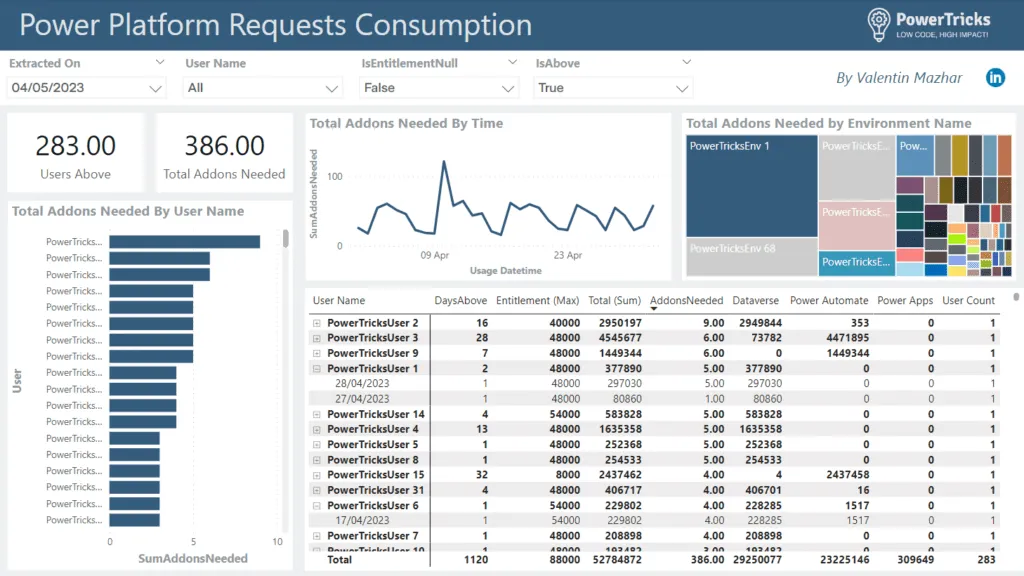
It is possible to create the above dashboard following the steps below.
-
Choose a SharePoint folder to store the reports that will be extracted each month.
-
Connect a Power BI report to the SharePoint folder and combine all the files in the same table. In the Power Query, create a column to contain the date of the report extraction.
-
Connect to the Dataverse systemuser table of the default Power Platform environment. This table is used to access the user details thanks to their ids included in the consumption report.
-
Add relationships between the main consumption table and the environment table.
-
Add some columns and measures to get additional information
-
Have fun with the visualization!
One of the objectives of such a report is to evaluate the situation. In practice, if a user is overconsuming their quota of requests, there are multiple ways to remediate the situation. However, it does help to have a single metric to follow. Here I propose to use the amount of API Calls Addons that would be needed if we consider a strict enforcement with the current assigned licenses. This can be quantified and can easily be translated in a cost.
As a bonus… Row level security (RLS) can be configured in Power BI to only share the data relevant for each user or team. Indeed, this can be particularly worth for wide organizations, where each user who opens the report would only see their own requests consumption. For international companies, it is also possible to use RLS to share the report with regional admins so that they can follow the consumption in their respective region.
The API Calls template described above is also included in the combined PPAC Reports Extractor Power BI report.
Is there any Power BI report templates for this?
There wasn’t… But now there is! I created a Power BI template with a few parameters for you to leverage this report easily. Check out my GitHub repository to download the template “API Calls Consumption Template.pbit”. I hope this will help you better manage Power Platform requests in your organization.
Newsletter
Stay in the loop
Get notified when I publish new articles on Power Platform Governance.

About Valentin Mazhar
Microsoft MVP and certified Solution Architect specializing in enterprise Power Platform governance, AI enablement, and operating models. With 5+ years delivering governance programs in regulated environments, Valentin helps organizations scale low-code and AI securely, building the foundations that let makers and agents thrive without compromising control.


