Better Govern Agents with the Copilot Studio Monitor
Copilot Studio is evolving fast, but governance and visibility capabilities haven’t kept up. The Copilot Studio Monitor fills critical visibility gaps by surfacing the configuration of every agent in a structured data model extended from the CoE Kit.
Until Microsoft delivers a complete, unified agent observability layer (hopefully coming soon with Agent 365), this solution aims to provide admins with the insight they need to govern Copilot Studio confidently and responsibly.
Below is a preview of the Power BI template included in the Copilot Studio Monitor.

Introduction
If you’re responsible for Power Platform governance, you’ve probably asked yourself a simple question about Copilot Studio:
How are we supposed to govern this thing?
The product has evolved so fast that governance guidance, controls and monitoring capabilities lag several steps behind. I wrote an article about Copilot Studio governance last year, and a good part of it already needs an update.
This post focuses on a narrower and one of the most painful challenges for admins: visibility.
If you can’t see how the agents are configured, which connectors they rely on, what knowledge sources they access, or whether they run autonomously, then you can’t govern them. Copilot Studio gives makers a powerful toolbox, but gives admins almost no way to understand what has actually been built. With increasing regulatory pressure, this lack of visibility becomes a direct compliance risk, not just an operational inconvenience.
To help close that gap, I’m sharing the Copilot Studio Monitor, a reusable CoE Kit extension and Power BI template that provides a detailed, tenant-wide inventory of Copilot Studio agents.
Note: this article covers agents created in the Copilot Studio portal only. Agents created through the M365 Copilot Agent Builder are stored and surfaced differently by Microsoft (a separate topic entirely) and are out of scope here.
More information about the why, the what, and the how below.
The Current Gaps in the Platform
The Power Platform has a consistent pattern: maker-and-end-user features ship quickly, while governance-related capabilities take much longer to mature. Copilot Studio is no exception. The core problem today is simple: admins lack the visibility required to understand what agents exist, what they do, and how they behave.
Below are the main gaps from the Power Platform Admin Center (PPAC) and Microsoft Admin Center (MAC) in terms of visibility over Copilot Studio agents. These gaps make it challenging to assess risk, lifecycle state, and AI configuration such as autonomy for Copilot Studio agents, all essential for governance.
The PPAC Inventory
This recent feature is still in preview. It provides a unified list of all agents across environments, exposing the data over a supported API.
What’s missing:
- Only basic metadata, no insights into tools, connectors, or knowledge sources
- No link to consumption or activity
It’s a starting point, but far from being really helpful for governance.
The PPAC Licensing Page
This area provides visibility over message and Pay-As-You-Go consumption. It allows to understand how many messages are consumed, and provides the information at environment, agent and feature level. The data is useful for cost management, but limited for governance.
What’s missing:
- No details on agent configuration (tools, connectors, knowledge sources, etc.)
- Raw reports for customized reporting have to be downloaded manually from the interface, every 30 days (I share a solution to automate it daily with the Reports Extractor, though with a non-supported API).
This page answers “how much do we consume?”, but not “what is consuming it”?
The PPAC Monitor
This is an interesting feature still in preview. The Monitor aims at providing visibility over health and governance metrics for the Power Platform. Recommendations are shared for Managed Environments only.
What’s missing:
- The official doc states that Copilot Studio-specific metrics are not available yet
- Recommendations only provided to Managed Environments
Today, this area is more of a roadmap placeholder than a practical tool for Copilot Studio governance.
The latest MAC Agent Registry
Microsoft Entra Registry, the latest announcement from Ignite (Nov 18th 2025). It is an evolution of the Copilot Control System from the MAC, promising to deliver a unified agent inventory across platforms (Copilot Studio Lite and Full). Available early to Frontier users, it should give additional visibility and control over MCPs. Future will tell if it provides visibility over all the relevant configurations for admins.
Conclusion on PPAC and MAC Features for Copilot Studio Visibility
These features point in the right direction: admins need a consolidated inventory, clear consumption data, and actionable governance recommendations. But there is still a large gap between that vision and what exists today. The three PPAC areas are incomplete, disconnected, and do not expose the configuration and operational details that admins actually need to govern Copilot Studio effectively. It is still too soon to comment on the MAC Agent Registry which I haven’t been able to test yet.
Since PPAC isn’t mature enough, most organizations rely on the CoE Starter Kit and the new Copilot Studio Kit to close these gaps. Let’s review where they help, and where they still fall short.
The CoE Kit & Copilot Studio Kit
These two kits are Microsoft Power CAT’s attempt to close the visibility gaps. And overall, they do an excellent job, especially compared to what the platform provides out of the box.
The CoE Starter Kit
I shared my thoughts on this kit a while ago, and two years later I still stand by them: it remains the best self-service governance option for organizations that need structure without committing to a third-party governance product.
Its strength lies in its rich data model (Makers, Environments, Apps, Flows, etc.), and the fact that it’s easy to extend or customize. For admins, this flexibility is invaluable. However, when it comes to Copilot Studio, the CoE Kit hasn’t caught up yet. It does collect an agent inventory through a dedicated sync cloud flow, but the data has significant limitations:
- The “published” status is incorrect: all agents appear as published, even those never published.
- Key configuration details are missing (tools, connectors, web search, autonomy).
It provides more context than PPAC Inventory thanks to its integration with the broader CoE model, but it still leaves major visibility gaps.
The Copilot Studio Kit
A much newer kit, also from the Power CAT team. In terms of visibility, it is the closest to what admins need today. To be clear, this kit is a lot more than just a visibility tool, but I will concentrate this review on this aspect anyway since this is the topic of the article.
The kit includes its own version of a CoE sync mechanism. Instead of iterating through agents with Power Automate, it offloads the heavy processing to a C# Dataverse plugin. The difference in performance is substantial: the plugin can crawl all environments, collect agents and related components, and process them in minutes (depending on tenant size). It also captures far more configuration detail than the CoE Kit and stores it in an elastic table.
From a performance and data-extraction perspective, it is excellent.
So why build the Copilot Studio Monitor instead of relying on the Copilot Studio Kit? Three reasons:
- Maintainability & Customization
The CoE Kit is easy to customize because everything is Power Platform-based.
The Copilot Studio Kit relies on a C# plugin. Customizing what data is extracted means editing, rebuilding and redeploying that plugin. Not ideal for most admins. - Integration with the CoE Kit Data Model
The Copilot Studio Kit is intentionally standalone.
But for organizations already using the CoE Kit, integrating Copilot Studio visibility into the existing governance data model is essential, especially for reporting. - Still missing data
Despite the improvements, not all configuration is captured. For example, the kit does not identify which agents have Web Search enabled nor the Computer Use tools, a valuable piece of information for governance.
Overall, the Copilot Studio Kit is a strong and highly performant toolkit that I would recommend for any organization serious about governing Copilot Studio. But for visibility, customization and integration reasons, I decided to build something different.
The Copilot Studio Monitor
First things first, the Copilot Studio Monitor can be downloaded in my GitHub repo below.
The solution is mainly composed of a customized sync flow from the CoE Kit, an enhanced CoE Kit Data Model to capture the Agents configuration, and a Power BI Template to report on the collected data.
The Data Model Customization
The way Copilot Studio Agents configuration is stored in the Power Platform
There are two main tables provisioned in all environments to store the Agents metadata: bot and botcomponents (display names are Copilot and Copilot Components):
- The bot table stores most of the information at agent level (name, Id, some configuration information such as authentication mode, etc.)
- The botcomponent table stores all information related to Topics, tools, and additional AI-related features. For example, if an agent has a Flow configured as a tool, this tool is described in a row of the botcomponent table, and it links the agent with the actual flow being called. This table stores most of the component definition in a column called “data”, in YAML format.
Therefore it makes sense for the CoE Kit to contain two tables: PVA Bot and PVA Bot Component. These are the two tables customized by the Copilot Studio Monitor.
The Customized PVA Bot table
The Copilot Studio Monitor solution contains additional columns to add to the PVA Bot table. These are presented below and are directly updated from the bot table of the agent hosting environment.

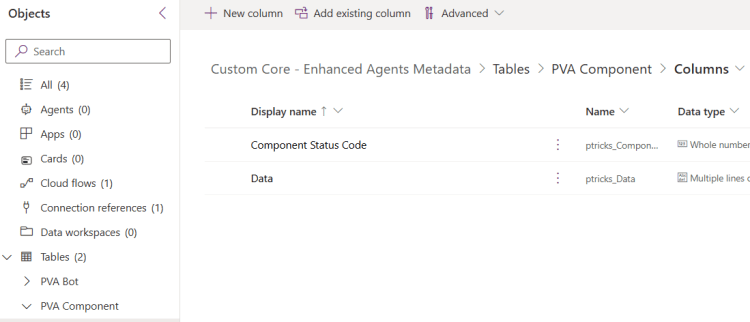
The Customized PVA Bot Component Table
As explained above, the definition of each agent component (Tool, Knowledge Source, etc.) is contained within the data column of the botcomponent table. This data column is not replicated by the CoE Kit out of the box. It means that the CoE Kit does not actually collect the detailed definition of each component, nor extract its information. The Copilot Studio Monitor does, and it does also collect the correct information regarding whether the agent is published (Component Status Code):
The Customized Sync Flow
The Customized Sync Flow is a duplicated version of the original “Admin | Sync Template v4 (PVA)“, with the below updates:
- It populates the added columns in the customized data model mentioned above
- It has an improved logic to only update the components which were recently changed when the variable “Full Inventory” is set to false (the CoE Kit version never updates existing components and only add new ones when the variable is set to false).
The Power BI Template
Overview
This is where the core value of the Copilot Studio Monitor lies. The Power BI report processes the data column of each relevant component to extract most of the configuration of each agent and report on it.


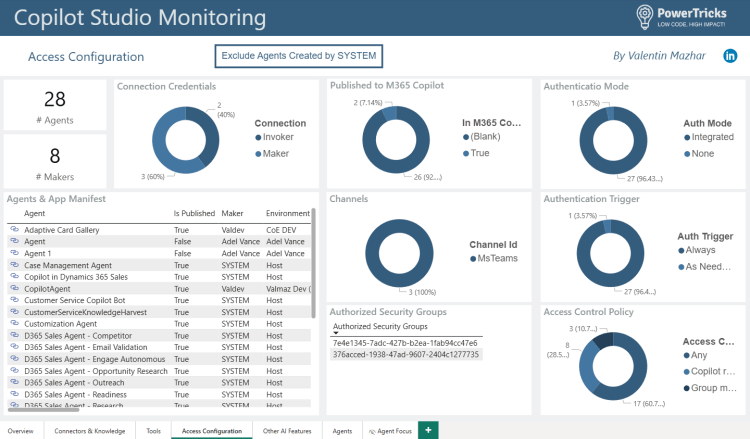


Several pages (Overview, Connectors & Knowledge, Tools, Access Configuration, Other AI Features) present the agents and their configuration. From any visuals, it is possible to right click and drill through to see the list of related agents:

This will then open the Agents page with the table of related agents. From this table or any other tables showing individual agents, it is possible to drill through a specific agent focus page:


Clicking on the buttons in the middle-right section will update the table on the bottom-right-hand corner to show the related objects. For example in the above screenshots we are showing the 2 Triggers configured for this specific agent. Clicking on “Knowledge Sources (4)” will show the 4 configured knowledge sources for this agent.
On any page, it is possible to include/exclude the agents created by SYSTEM. This is helpful to be able to easily focus on agents created from scratch by users as opposed to the default agents created by Microsoft (such as D365 Sales Agents, etc.).
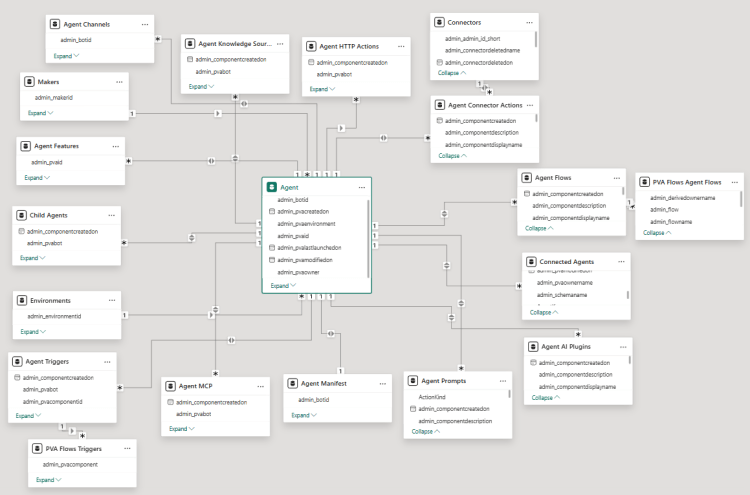
Behind, the data model looks like below:
Limits & Future Improvements
This solution is a first attempt at improving reporting on Copilot Studio. Here are some limitations and perspectives of improvements:
The extracted configurations are not saved in Dataverse
The reason is the fact that the component definition is formatted in YAML in the data column of each component. Extracting information from YAML is fairly complex from Power Automate and would require many expressions. This is precisely what the PowerCAT team does with the C# plugin in the Copilot Studio Kit, which allows them to use Regular Expressions.
Instead, I am using M Queries and created custom functions to extract the relevant information from YAML. The extracted configurations are therefore stored in Power BI. For Admins that are used to store data in Dataverse and use it for their governance processes, this is not ideal. Here are some possible workarounds:
- Instead of reading Dataverse, it is possible to use the Power BI connector to run a query against the Power BI semantic model from a cloud flow. It becomes possible to trigger automated processes and address all non authenticated agents for example, without passing through Dataverse.
- It is also possible to create a Dataflow to write the data back to Dataverse. New columns will need to be created, and the extracted configuration would then be automatically written back to Dataverse.
No usage data
This current template does not integrate with usage Data. It would be a good opportunity to integrate with the data extracted with the PPAC Reports Extractor providing daily message consumption for each agent. Here again, a similar approach is used in the Copilot Studio Kit to download agent consumption data (same old non-supported API as in the PPAC Reports Extractor 😱), although they also use a plugin to extract the information and store it back to Dataverse.
I will likely add this in a future release to connect the Power BI Report to the raw reports extracted to SharePoint.
Single Platform
The Copilot Studio Monitor only provides visibility over Agents created on Copilot Studio Portal.
Conclusion
Interesting timing as Microsoft announced Agent 365 as I was just finishing this article. Future will tell whether the new Agent Registry provides all the data points that the Copilot Studio Monitor provides. In the meantime, this solution is available and free to use to gain visibility about Copilot Studio Agents configuration.
Feel free to subscribe if you liked the post
Don’t hesitate to share your thoughts in a comment! If you would like to see more posts like this then feel free to subscribe to this blog. You won’t be spammed, just informed when there is some new Power Platform related content.


2 Comments
Martijn Zoomers · March 31, 2026 at 11:48 am
Good stuff! The MAC agent inventory is also exposed via Graph API:
https://www.microsoft.com/en-us/microsoft-365/roadmap?id=502875
https://learn.microsoft.com/en-us/microsoft-365/copilot/extensibility/api/admin-settings/package/overview
It’s still in preview and limited in the information it returns, but this is a crucial component for automation of agent governance controls.
Valentin Mazhar · March 31, 2026 at 6:38 pm
Hey Martijn, it’s a good point and I will add this in the article for transparency, thank you 🙏
That said, unfortunately visibility over actual features and agent configuration provided by the API still falls short vs what is needed to properly govern the product.
In the ideal world, the API will provide detailed information over what the agents can do, showing specific tools and knowledge configured. And even better if there can be an interface to efficiently surface and browse through the info.
In the meantime… The Copilot Studio Monitor can fill the gaps 🙂